Sunday, September 26, 2010

Review of current positions & portfolio performance

Let's review the current positions in the portfolio and the performance of each of them. I updated the stop losses on all my positions. The new level of the stop loss is visible on the chart of each stock below.

For the "Agricultural tracker" DBA (PowerShares DB Agriculture Fund ETF), I entered at a price of $25.99 on November 24, 2009. See my post of November 22, 2009 on investing in agriculture. The price is currently at $27.9, generating a performance of +7.3% in 10 months.
 I raise my stop loss from $20.0 to $26.5.


For the "Gold tracker" GLD (SPDR Gold Trust), I entered at a price of $115.2 on July 30 of this year. Current price is at $126.69, which means a performance of +10% in 2 months. I raise my stop from $111 to $120.5.

For the "Sugar tracker" SGG (iPath Dow Jones-UBS Sugar Total Return Sub-Index ETN), I entered at a price of $43.2 on June 11 of this year. See my post of June 8 on sugar. Current price stands at $71.20, generating a return of +64.8% in 3.5 months. I raise my stop from $48 to $60.
The price of sugar, as well as other soft agricultural commodities (coffee, cotton, rice, corn, wheat, soybeans), has increased a lot in the last 3 months.


For the gold and silver mine CDE (Coeur D'Alene Mines Corp), I entered at a price of $15.8 on May 19, 2010. Currently the price stands at $19.61. Return: +24.1% in 4 months. I raise my stop loss from $14.0 to $18.5.

For CAF (Morgan Stanley China A Share Fund), my entry price was $29.38 on August 17, 2010. Current price is at $28.49, generating a loss of 3% in 1 month. I raise my stop loss from $22 to $26.5.


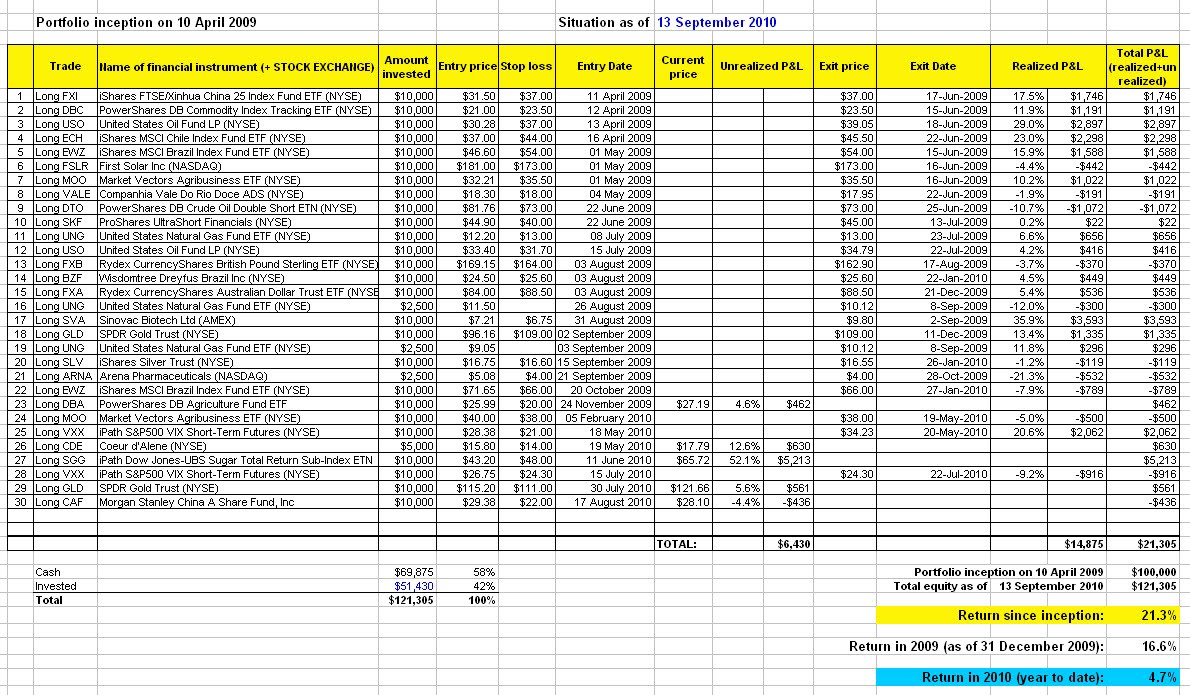
As of today, I reach an overall portfolio performance of +7.4% year-to-date.

Let's benchmark this performance with the S&P500 index: this index a made a performance of +3.01% year-to-date.


On the table hereafter is a recap of open positions and the revised stop loss levels highlighted in yellow.

Monday, September 13, 2010

Portfolio performance


Performance of my portfolio as of today:

Return in 2010 (year-to-date): +4.7%
Return since portfolio inception on April 10, 2009 (17 months ago): +21.3%

Tuesday, August 17, 2010

Portfolio update

Buying Morgan Stanley China A Share Fund (CAF)

I refer to a previous post dated August 2, in which I said that I was getting prepared to buy the Morgan Stanley China A Share Fund (CAF). This time has come. I am buying CAF today for my portfolio at a price of $29.38 for a total of $10,000. Stop loss: $22.0


Thursday, August 12, 2010

US Dollar Index


The US Dollar index moved sharply higher yesterday. It rebounded on its support at $80.
A bullish divergence had been building between the price and the MACD, announcing this move higher. Additionally the USD index was very oversold and a retracement made sense. However, according to my system, as long as the 20 day moving average will not cross the 50 day moving average to the upside, I stay bearish.

Tuesday, August 3, 2010

S&P500 index: buy signal

I use a simple system to tell me whether it is time to buy or sell the S&P 500 index (this index is a good proxy for the stock markets in general):

1) First filter: I go long only if the price is above the 200 day moving average (MA), i.e. the blue line on the chart. And I only go short if the price is below the 200 day MA.

2) Second filter: If the 20 day MA (pink line on the chart) crosses the 50 day MA (yellow line on the chart) to the upside, it is a buy signal. To the opposite, if the 20 day MA crosses the 50 day MA to the downside, it is time to sell.
This system worked pretty well in the past as you can see on the chart above

Yesterday the S&P500 index moved above the 200 day MA: first condition met. And two days ago, the 20 day MA crossed the 50 day MA to the upside: 2nd condition met. Buy signal was therefore activated.

Monday, August 2, 2010

Morgan Stanley China A Share Fund (CAF)

I refer to my previous post on the Shanghai stock market, where I mentioned my interest to invest in China at this point in time. To gain exposure to this market, I am planning to buy for the portfolio the Morgan Stanley China A Share Fund, Inc (ticker: CAF) listed on the New York Stock Exchange. The Fund invests at least 80% of its assets in A-shares of Chinese companies listed on the Shanghai and Shenzhen Stock Exchanges.

Below a weekly chart of the Shanghai Se Composite index. 


And here the weekly chart of Morgan Stanley China A Share Fund:


The price of CAF has broken the 40 week (= 200 day) moving average to the upside. I am getting prepared to buy...

Portfolio update

Friday, July 30, 2010

Buying SPDR Gold Trust ETF (GLD)


I am buying for my portfolio the Gold tracker SPDR Gold Trust ETF (ticker: GLD) on the New York Stock Exchange at a price of $115.20 for a total of $10,000. Stop loss: $111.00 (a bit below the 200 days moving average).

Thursday, July 29, 2010

Sugar tracker (SGG): an update


Since I bought SGG for my portfolio on June 11 at a price of $43.2 (link to post here and here), this ETF is already up 25% and is now priced at $54.07.

I am raising my stop loss from $38 to $48.

See the above chart: next target is the 200 day moving average at a price of $58.